SAFE: Survey results and map of (un)safe locations in Nis
The Center for Girls conducted an anonymous survey on safety in public places in Niš with 241 participants of empowering self-defense workshops. The survey, same as the workshops, was conducted within the project SAFE: Empowering girls and women to feel safer in public places in Nis, which was supported by UN Women.
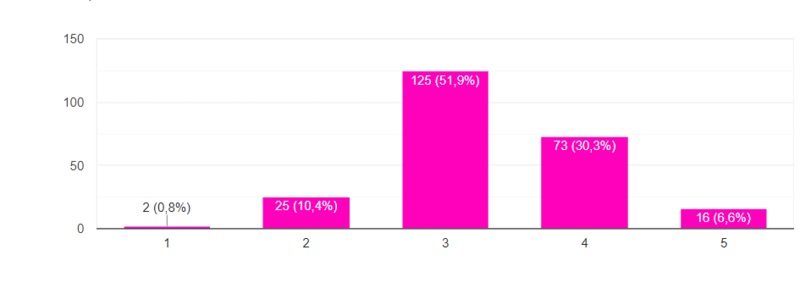
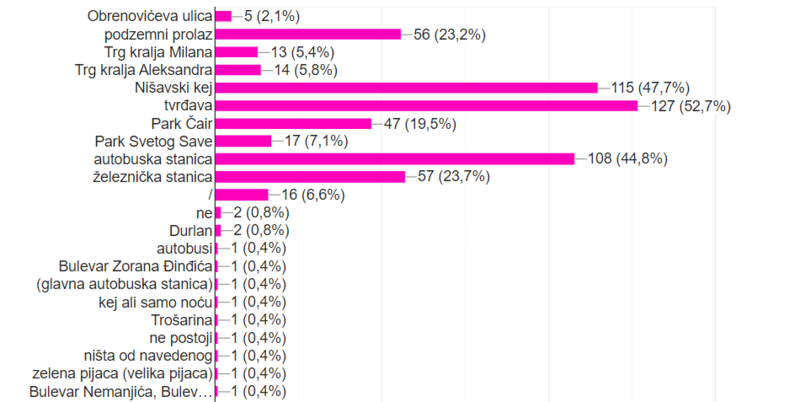
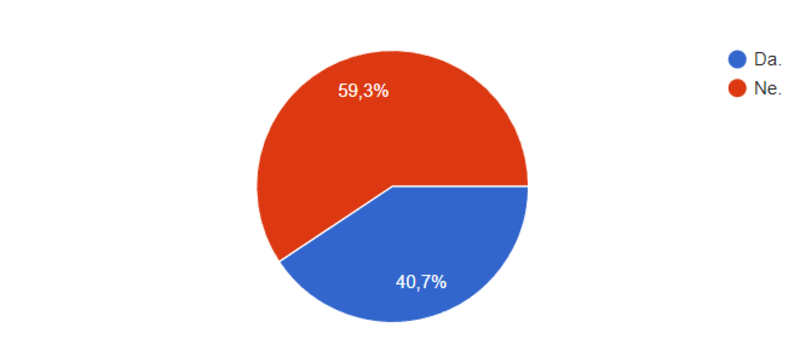
The survey showed that as many as 51.9% of respondents feel moderately safe in public places in Niš, and that only 6.6% of them feel completely safe. When asked in which public places the respondents do not feel safe, as many as 74.7% of the answers included the option of streets and passages, 51.9% of bus stops and public transport, 49% of quays, and 47.3% of the option of bridges and overpasses. These were the most common answers, and immediately after them, a large percentage of answers included: parks, squares, promenades and pedestrian zones. Some of the answers related to dark and unlit places, taxi transport, the fortress at night, settlements at night, the part of the city around the bus station and the market in the center, the train station, public toilets, baths and swimming pools… Of the specific locations, the respondents were the most unsafe respondents singled out: Tvrđava (52.7%), Nišavski quay (47.7%) and the bus station (44.8%), and then, a slightly lower percentage of answers, also included the following places: the railway station (23.7 %) and underground passage (23.2%), Chair park (19.5%). Finally, on the list of unsafe places, although much less often, there were: Park Svetog Sava (7.1%), Trg kralja Aleksandra (5.8%) and Trg kralja Milana (5.4%) and Obrenovićeva Street (2, 1%). As many as 40.7% of respondents stated that they experienced some form of violence or harassment in a public place. 33.7% of them stated that they had experienced verbal violence, making this type of violence the most common. Comparing the answers to these two questions showed that a number of respondents, especially of high school age, do not recognize verbal violence as violence. Sexual harassment was experienced by 13.7% of them, while physical violence was indicated in 4.9% of responses.
Of the measures that could be implemented in order to increase the level of security in public places in Nis, the most frequently chosen answer was that citizens should be made aware that they should react to violence (79.3%), and others the most frequently chosen answer was better lighting in public places (73%). A large percentage of responses also referred to learning self-defense techniques (61.8%), and these responses were followed by an increase in police patrols with 53.9%. The respondents also wrote the following answers: controls through cameras, carrying and better legal regulation of the use of means of self-defense such as pepper spray and tasers. Based on the selected locations, an interactive Google Maps map of unsafe locations in the city was created. Locations are marked with colors (from red – the most unsafe, to green – the safest). By clicking on each location, you can get an insight into the percentage of respondents who consider the location unsafe. As the survey was conducted in high schools and colleges that are mostly in the territory of the municipality of Mediana, many locations that are outside that territory were not recorded during the survey, and therefore not on the map, which does not mean that they are/are not safe, but that for them we currently do not have enough data (blue marks).
Link to the map: